
How Pythia is built
From the vision to a system for sales and purchasing – told month by month.
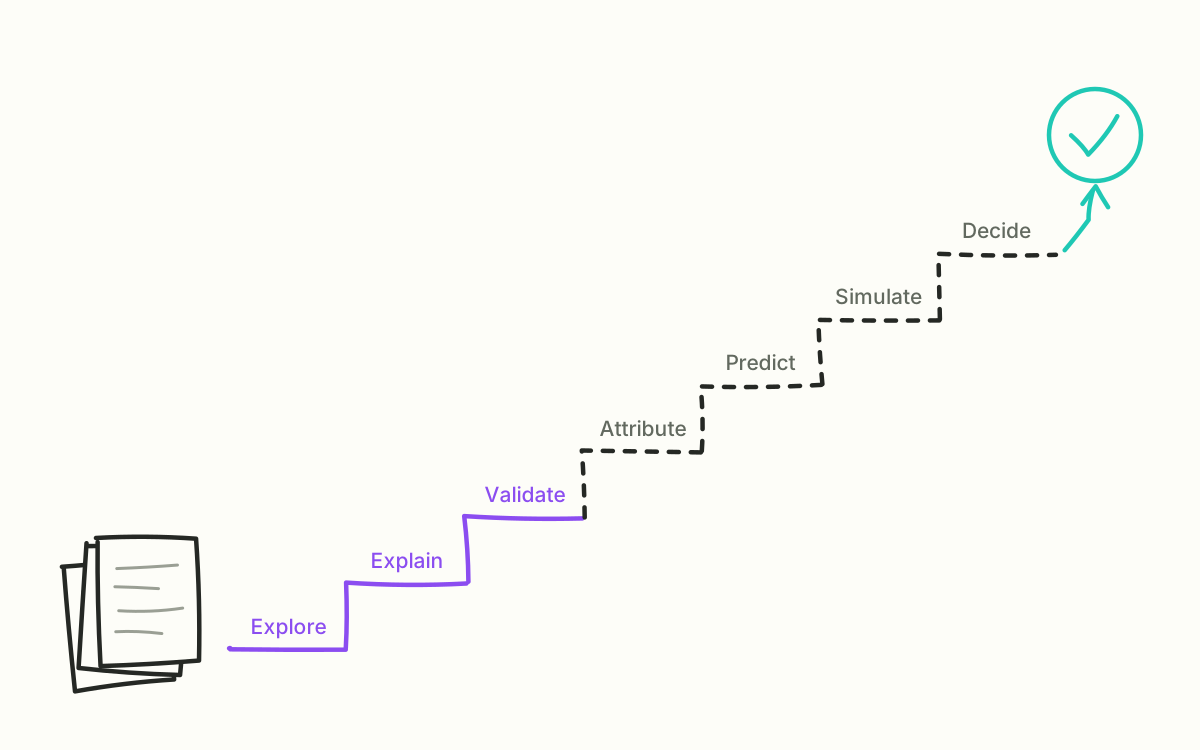
Part I · Foundations
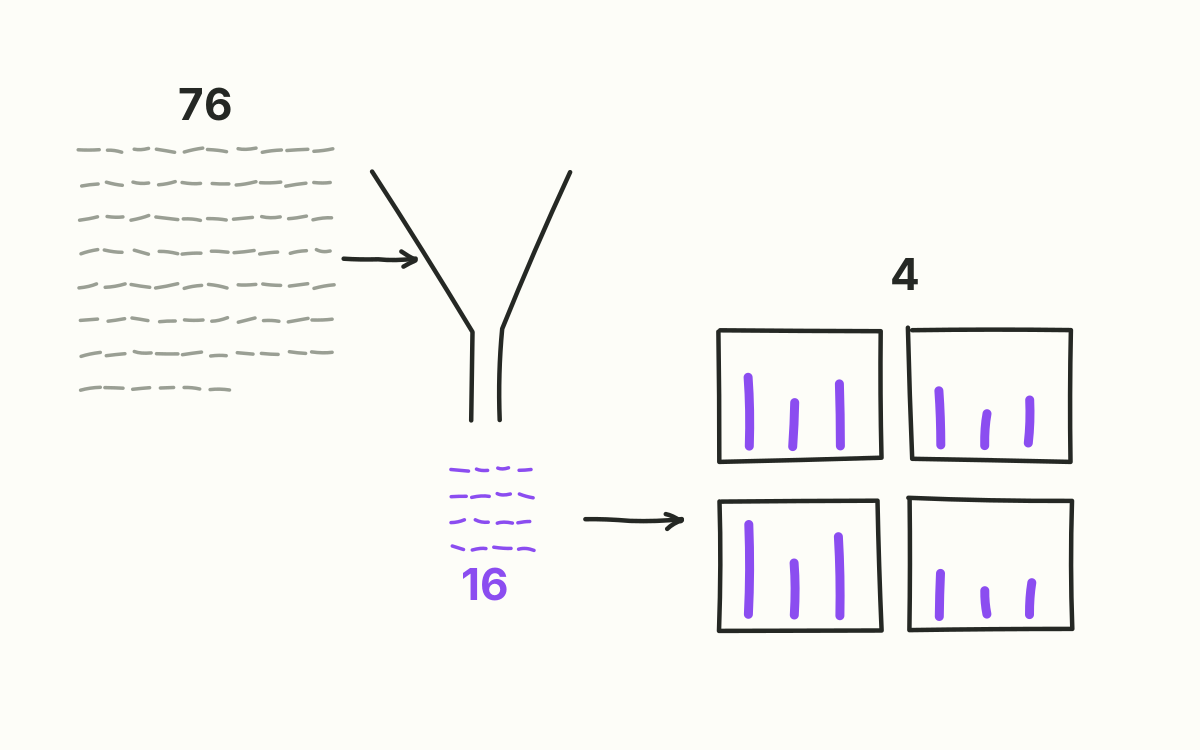
One CSV, four reports
The first prototype read 16 of 76 columns – and showed how much the other 60 hold.
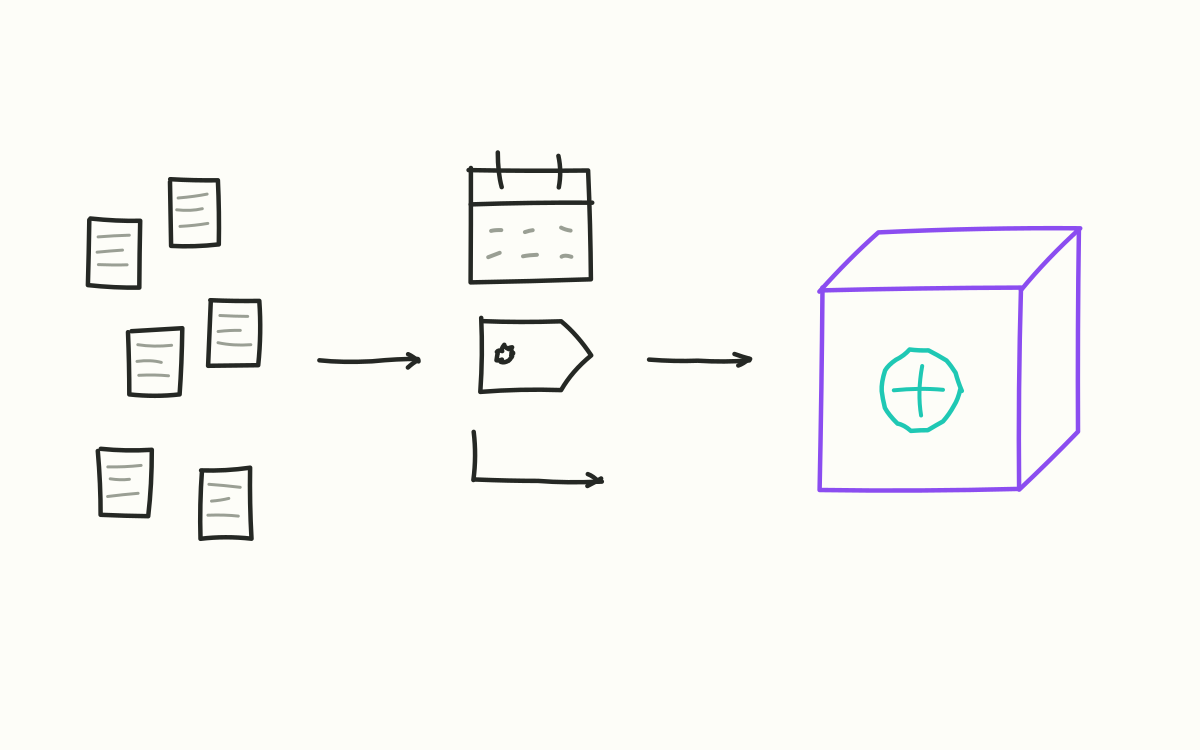
A platform, not a report
Why Pythia collects data first, structures it next and only then calculates.
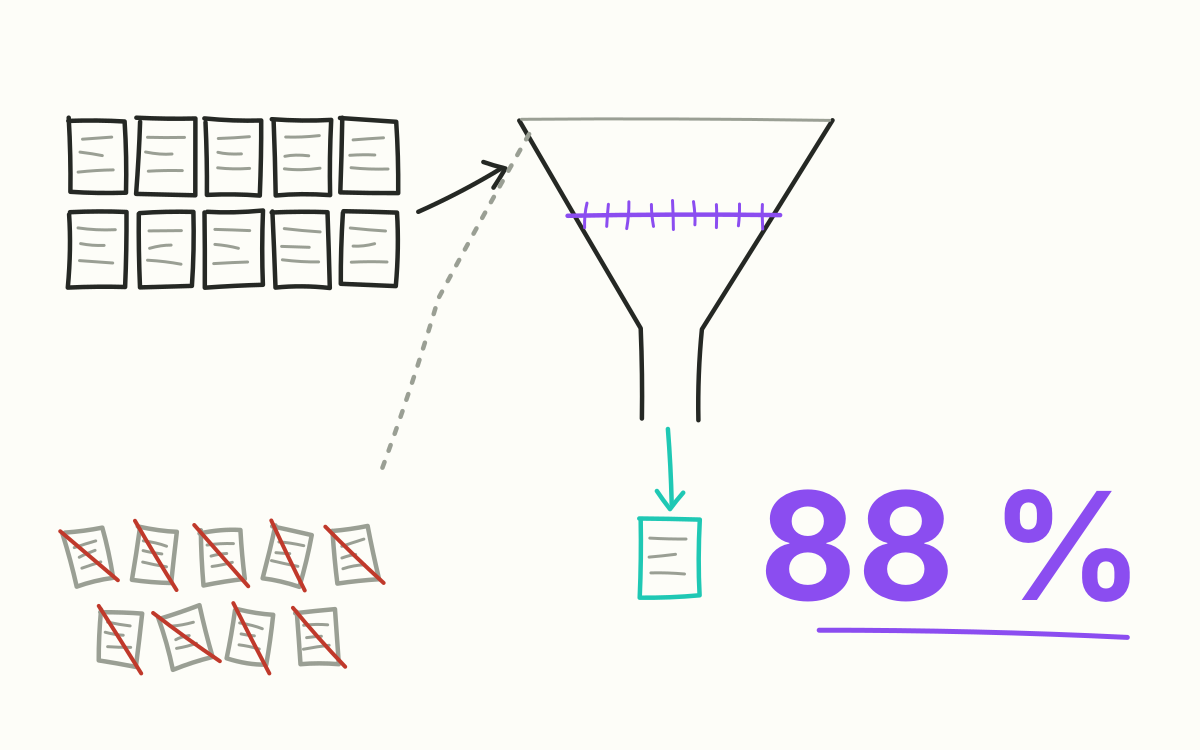
The 88 percent
Nearly nine in ten sales went missing without anyone noticing. Why data quality is a task of its own.
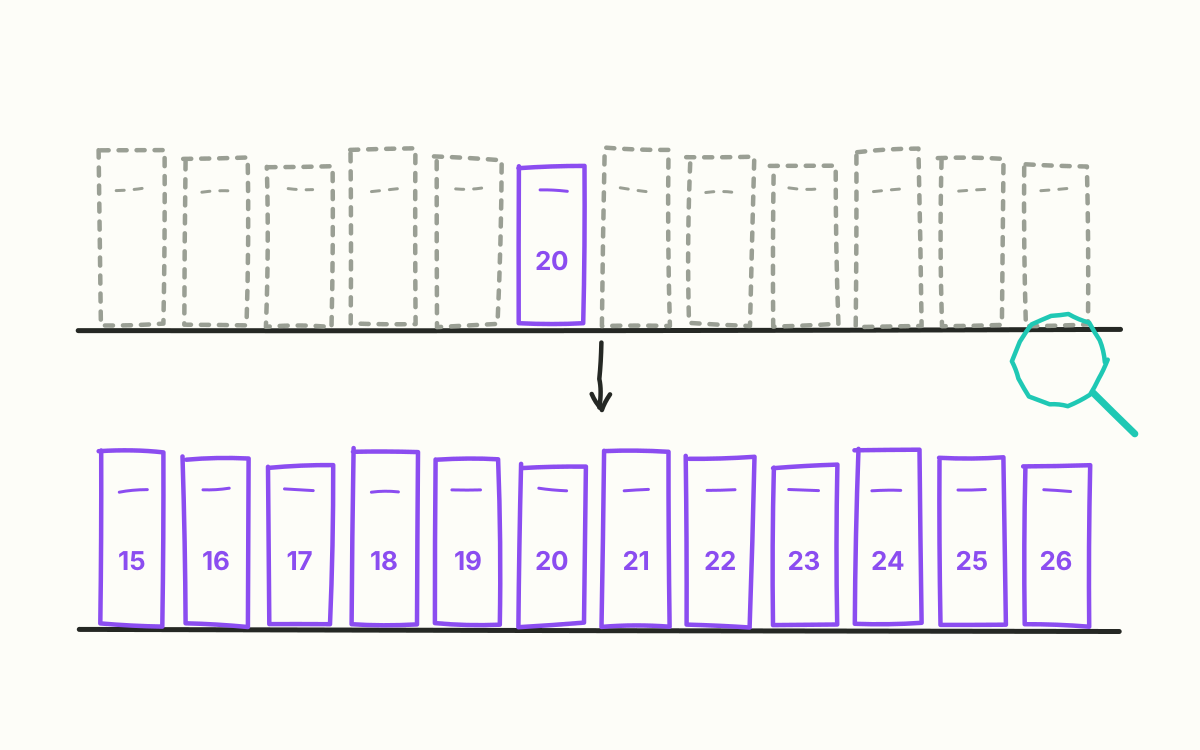
Every year in view
Comparison needs history: Pythia now keeps every year, back to 2015.
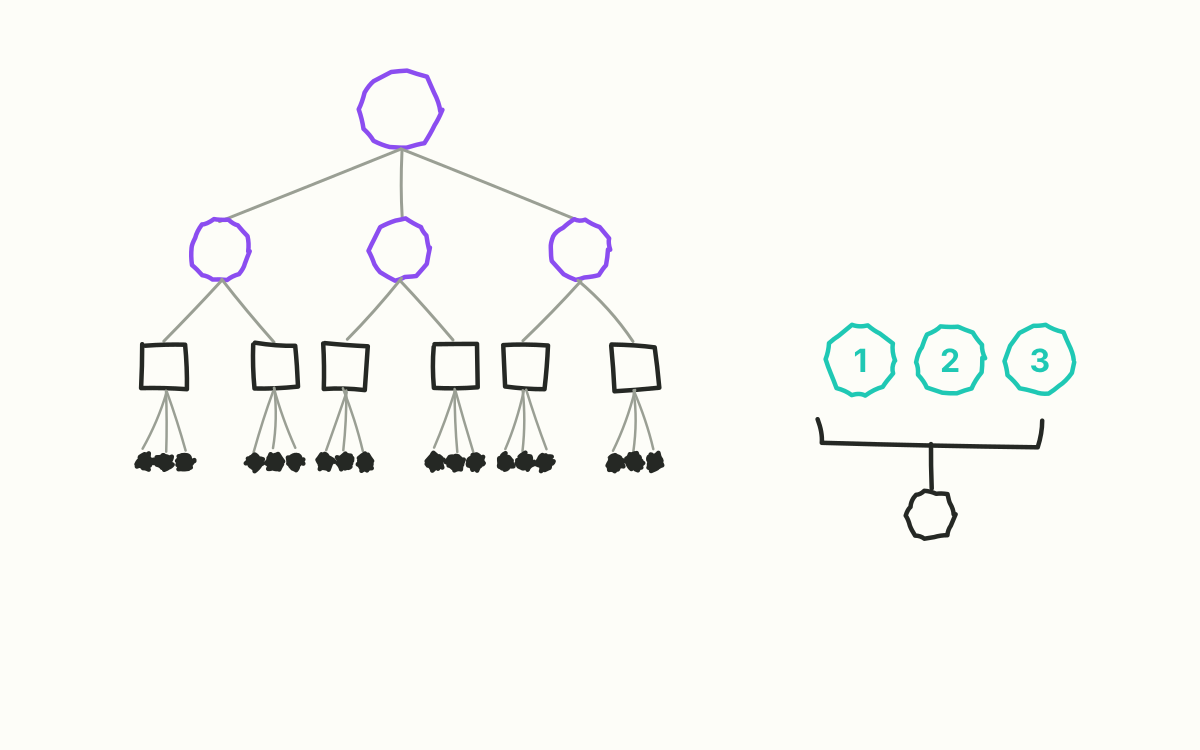
Order in the range
Clusters, product groups and families: from the big picture down to a single item.
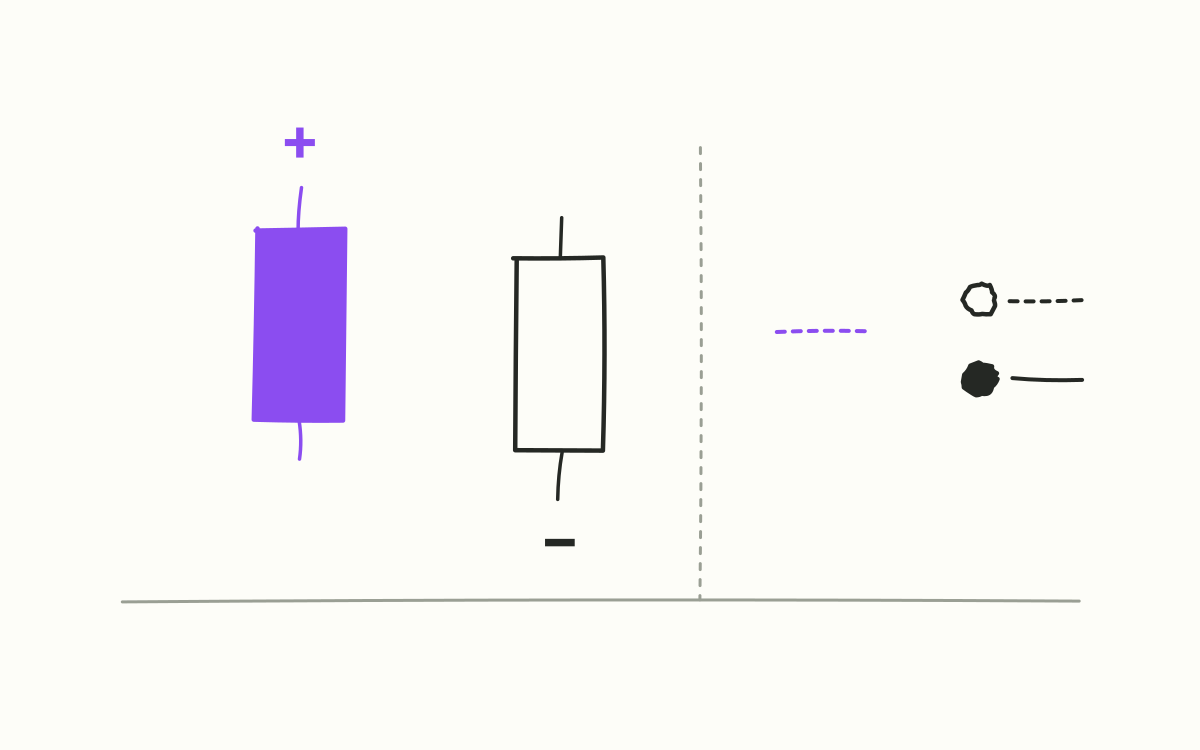
The sales candle
Why we show sales like a share price – and what one candle tells you about a day.
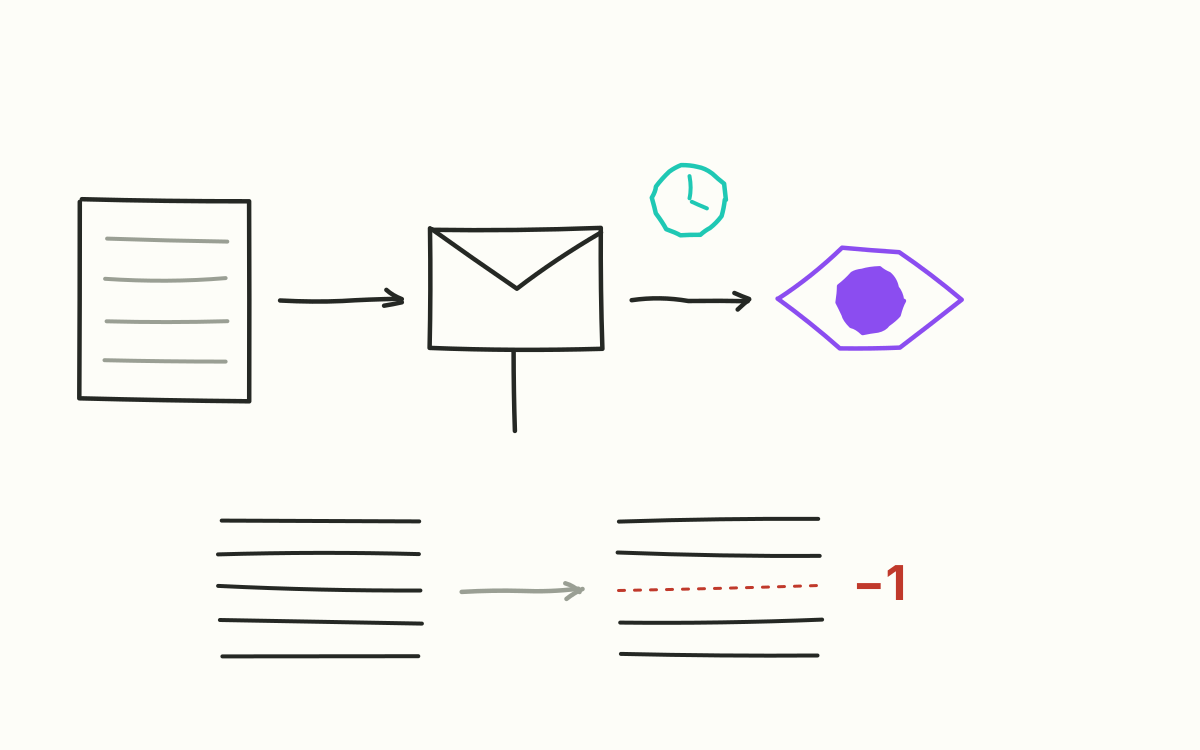
Data that arrives on its own
Automatic intake collects receipt data, checks it and reports what doesn’t fit.
Part II · Explore and Explain
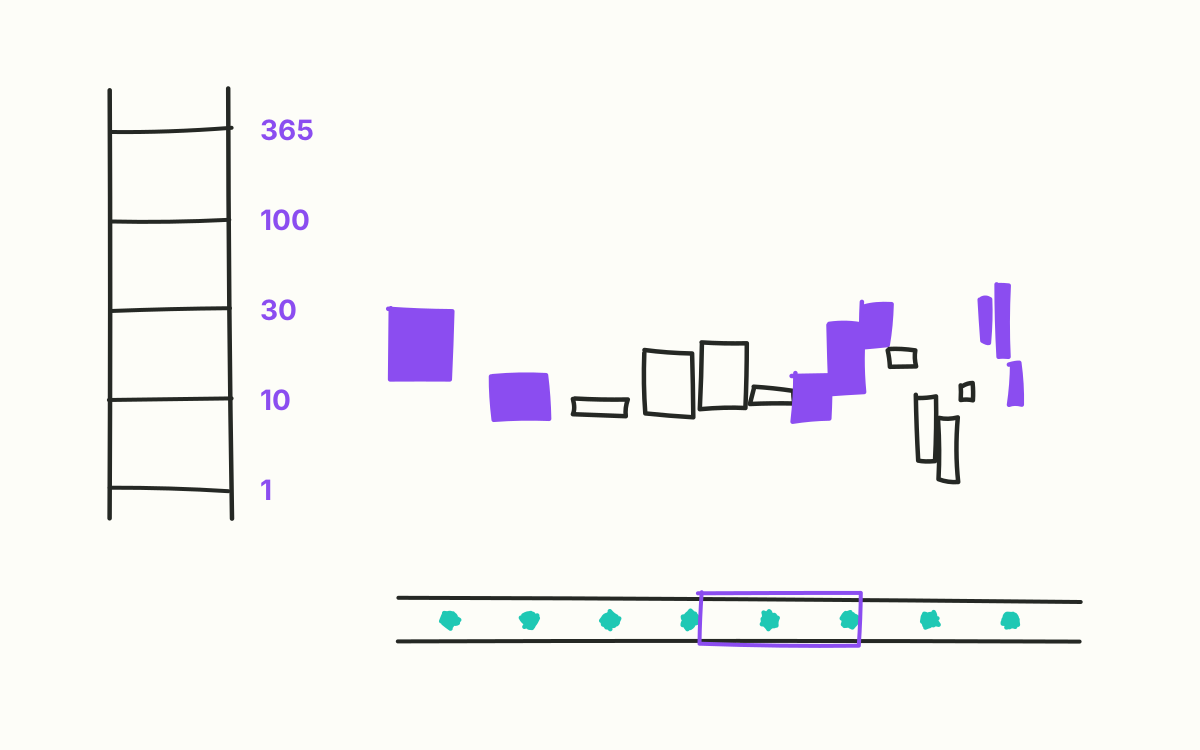
The timeline is here
From year to day, compared with last year: Pythia’s central view.
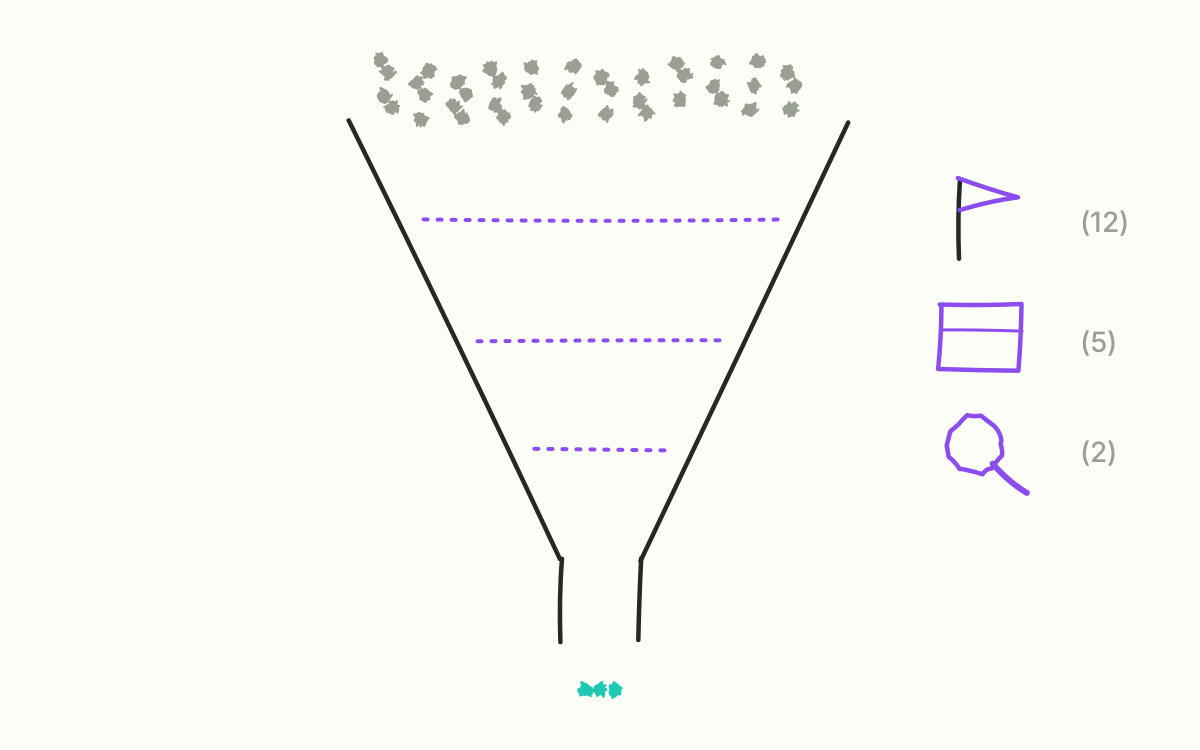
Filter the way you think
Multi-select, search and drill-down – asking questions without writing a query.
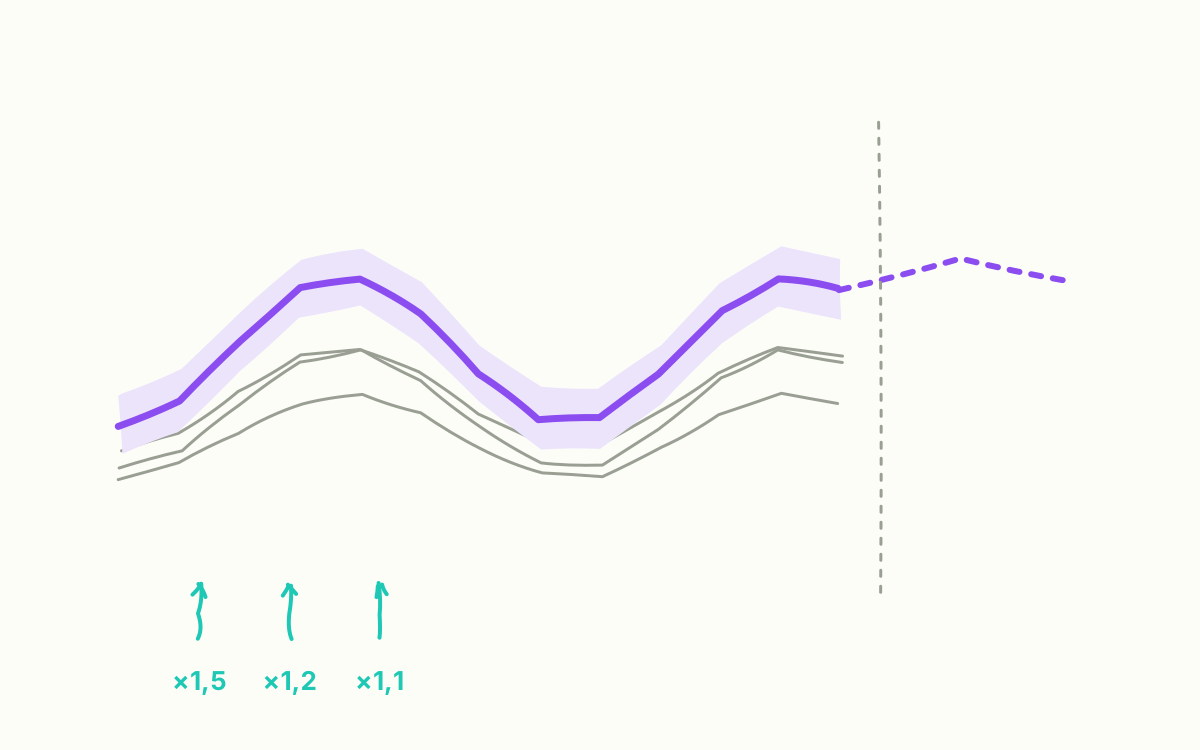
What normal looks like
The seasonal profile shows what to expect from a day – and the timeline now reaches into the future.
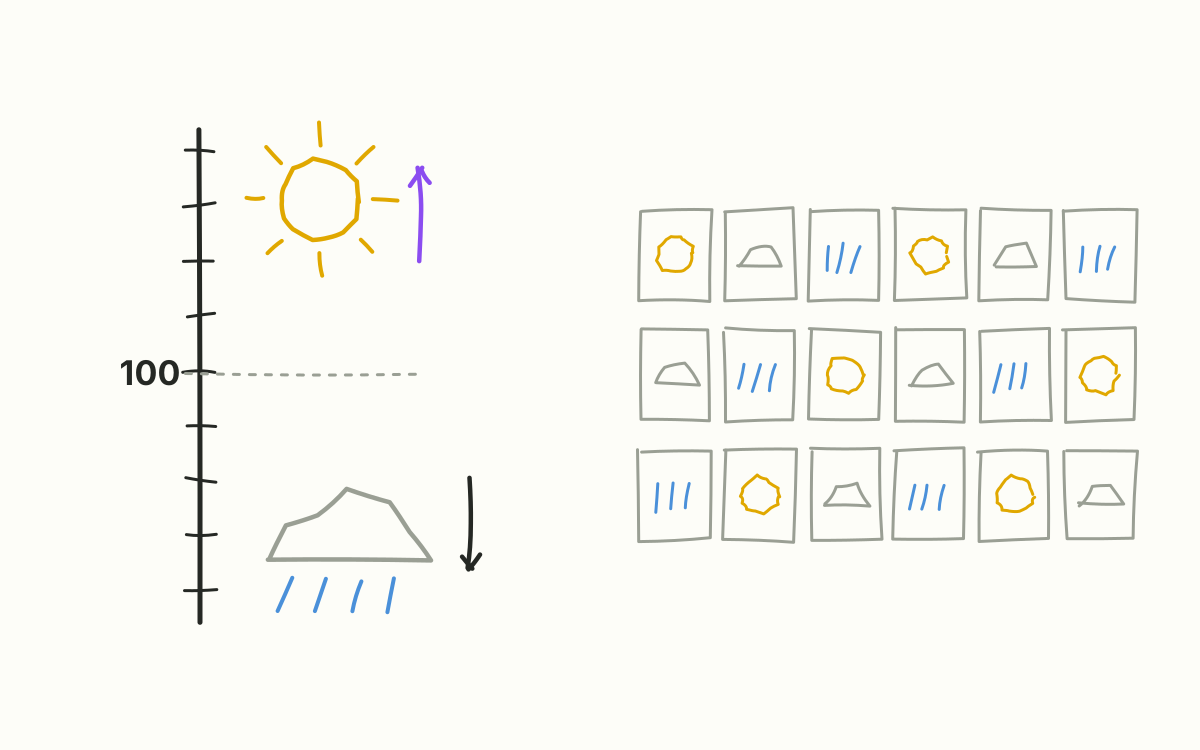
Shopping weather
What rain does to sales: an index built from weather and season.
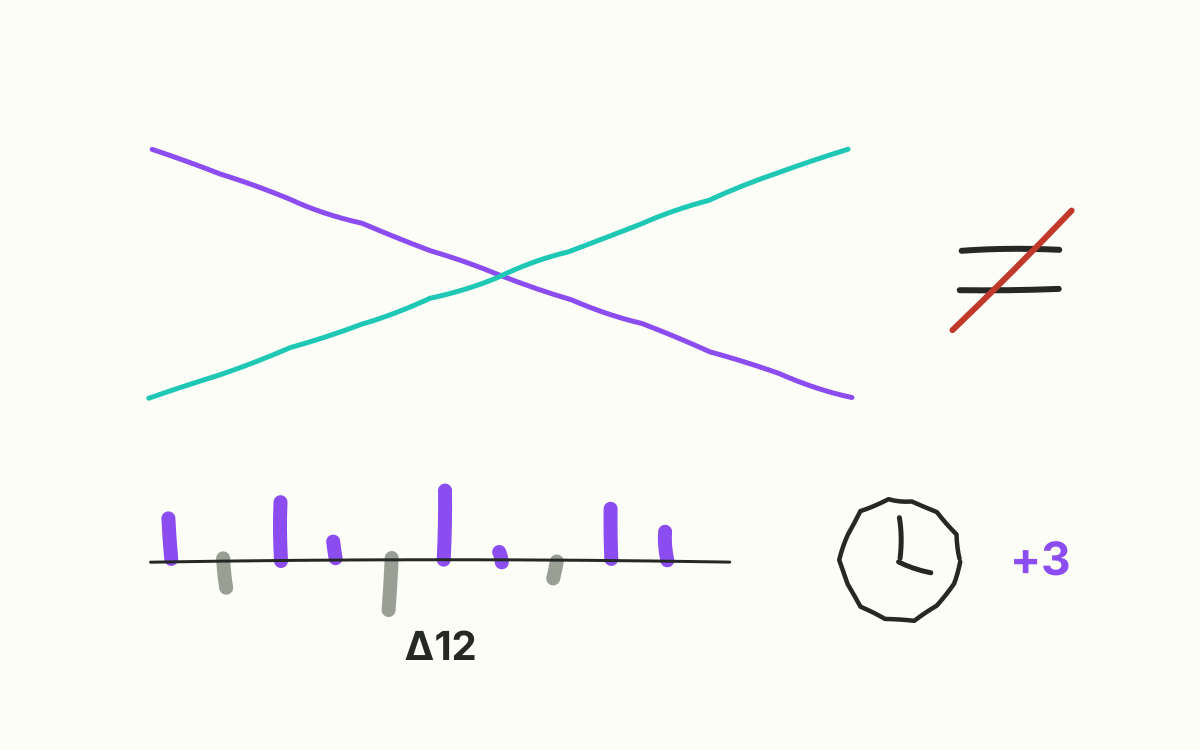
Consumer climate, ifo, inflation
Showing the big indicators – and measuring whether they actually explain anything.
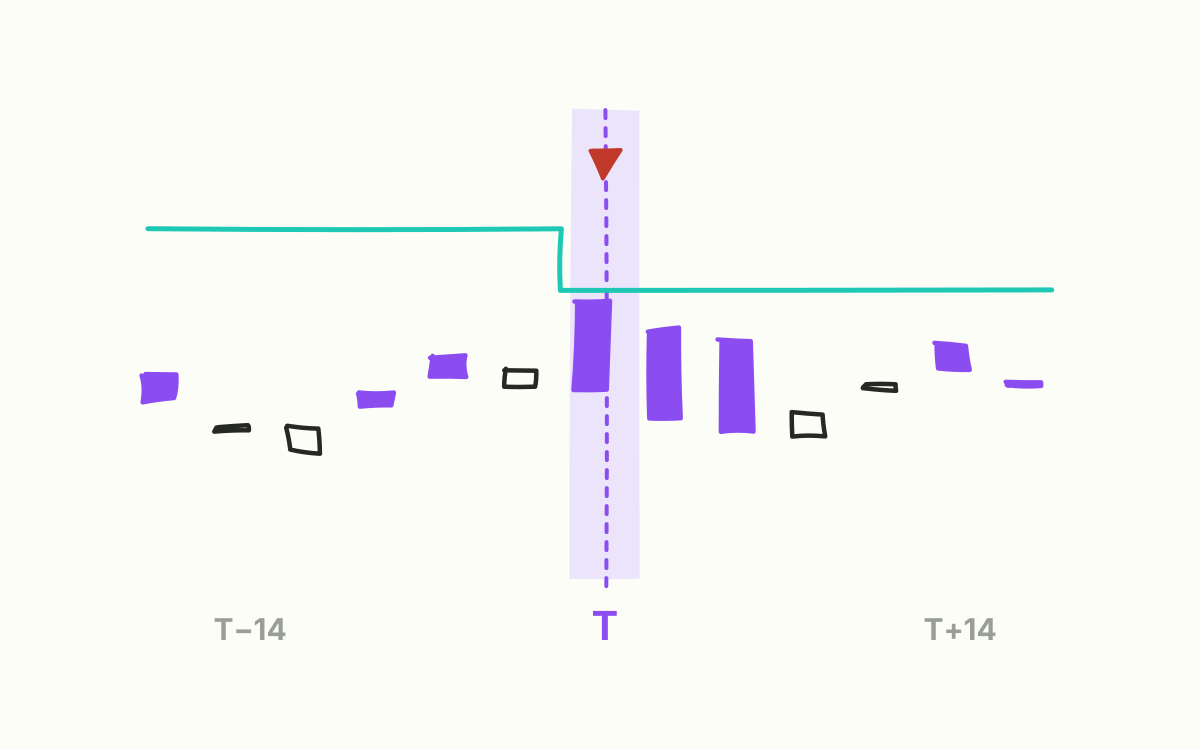
Events as objects
Promotions, prices, before and after: an event is more than a dot on the calendar.
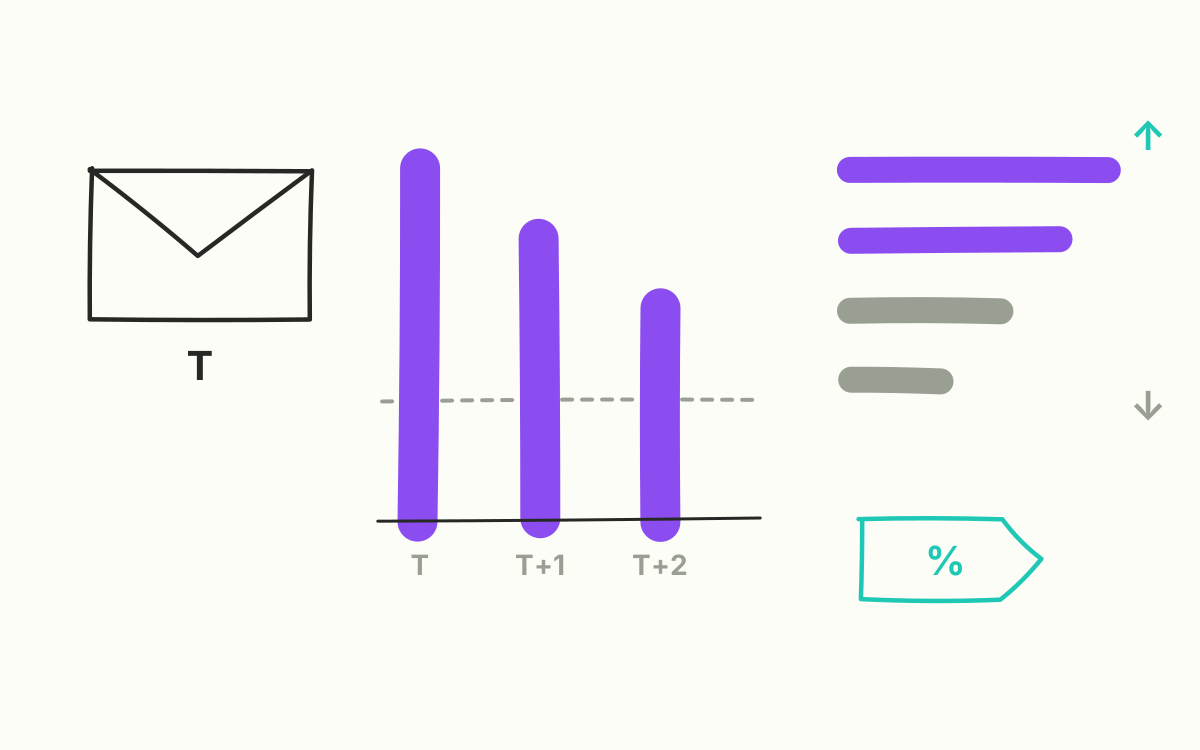
What did the newsletter do?
Impact per send and promo codes, conservatively attributed.
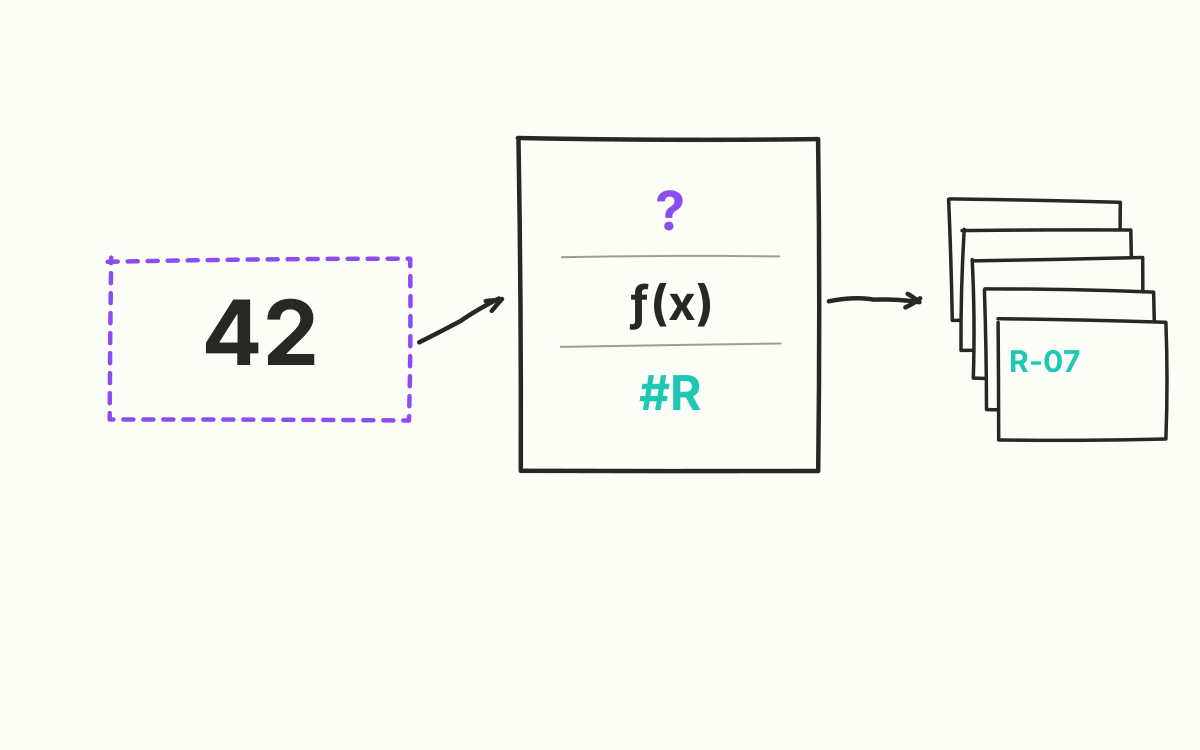
Every number explains itself
Explain mode shows the rule behind every number.
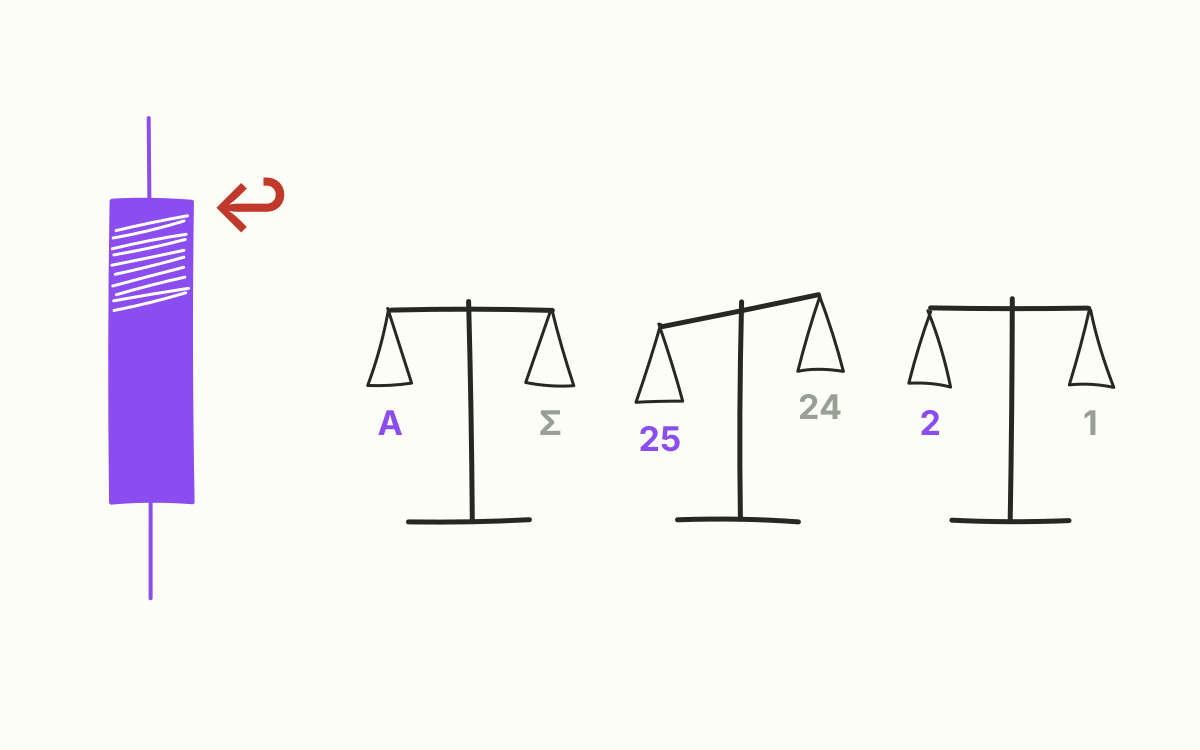
Returns and credits
The flip side of revenue: rates, outliers per item, credits on the timeline.
When the details have to be right
Bundles, carriers, expected values: small rules with a big effect on every number.
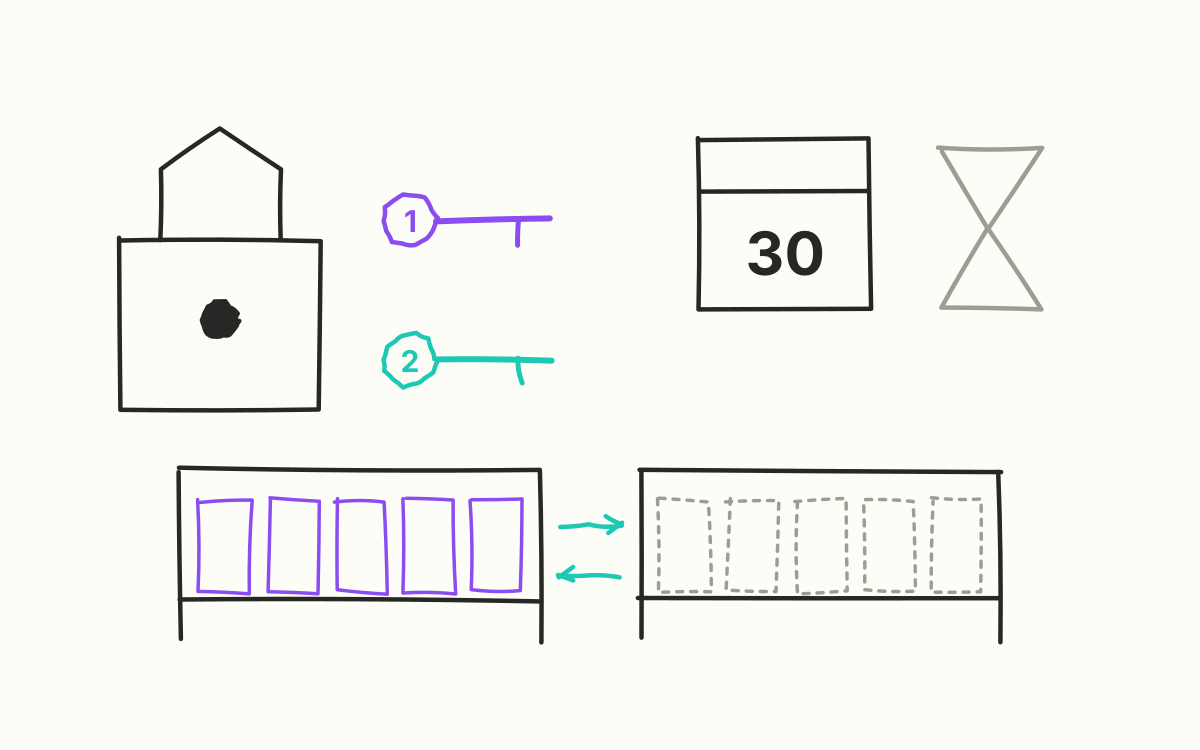
Ready for operations
Roles, two-factor login, an admin area – and a data build that runs three times faster.